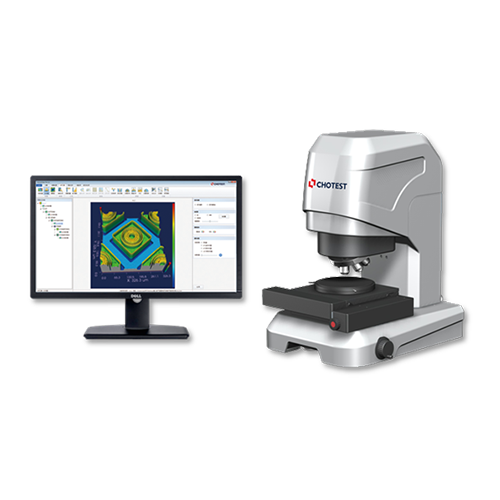
VisionX professional visual measurement software is completely independently developed by CHOTEST, and CHOTEST has independent intellectual property rights. VisionX has friendly user interface, convenient operation, powerful and practical functions, support more than 80 kinds of extraction and analysis tools, including feature extraction tool, auxiliary tool, annotation tool and special application tool, etc. Moreover, functions can be customized according to user's need, so as to improve work efficiency more effectively.
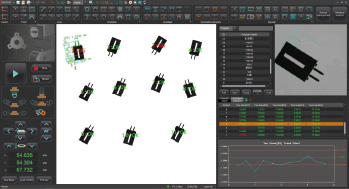
Home Interface
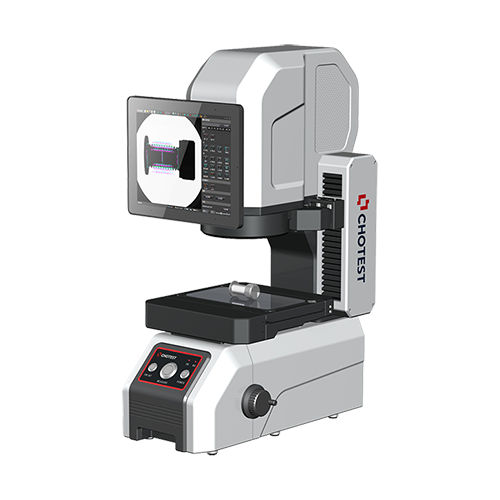
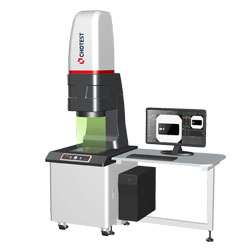
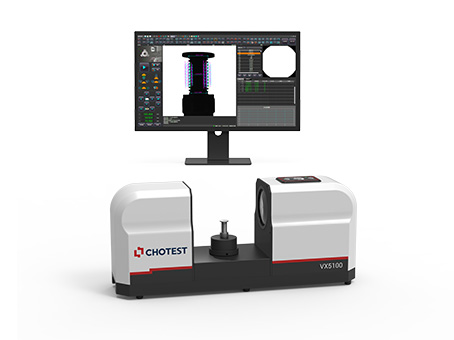
| Model | VX5100 | ||
| Image Senor | 5MP CMOS | ||
| Outside Monitor | 24" LCD (XGA:1920×1080) | ||
| Acceptance Lens | Double Telecentric Lens | ||
| Back Light | Telecentric transmission illumination | ||
| F.O.V. | Φ100mm | ||
| Repeatability | ±2um | ||
| Accuracy *1 | ±5um | ||
| Software | VisionX | ||
| Resolution | 0.1um | ||
|
XY Obejct Table(Optional) |
Retational Speed | 0.2 Revolution/s | |
| Diameter | Φ60mm | ||
| Capacity | 3kg | ||
| Size(LxWxH) | 736×200×325mm | ||
| Weight | 25kg | ||
| Input | AC100~240V,50/60Hz,1.3A,150W | ||
| Working Environment | Temp.10 °C~35 °C, Humidity 20~80%, Vibration<0.002g, Less than 15Hz | ||
|
Remark: *1 In the focus position, the environment temperature is +20 °C ± 1.0 °C |
|||
Geometric Tolerance Straightness, Roundness, Concentricity, Symmetry, Positional Tolerance, Parallelism, Perpendicularity, Profile Tolerance, etc.
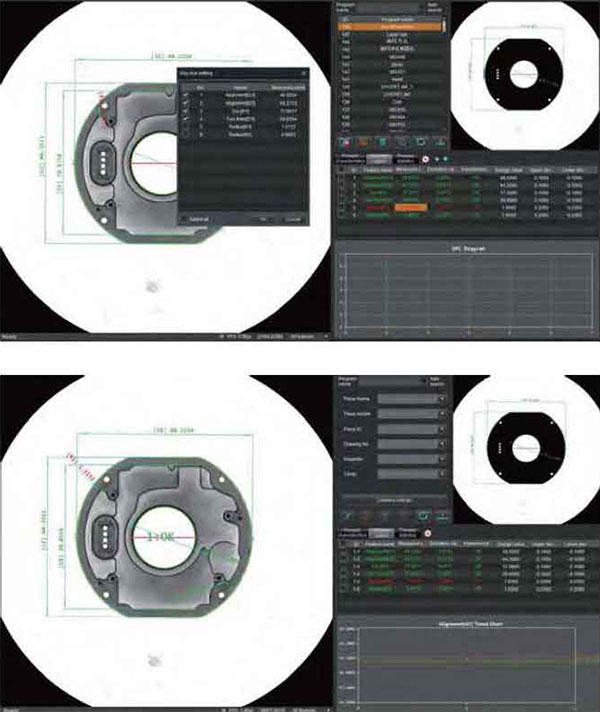
CNC Mode Modify CNC program anytime, as well as adding or reducing features, OK or NG is concluded according to tolearance in CNC program
Automatic Only need to select the measuring features, after placing the workpiece, measuring results can be obtained quickly by one key
Coordinate System Can create coordinate system by Point-line, Line-line, and translate & rotate coordinate system, as well as create multi-coordinate system
Special tools Rounded corner, Contour, Thread, Slot, Perimeter, Pitch distance, Thickness, Chamfer, Spring, Gear, Sealing gasket, area, Pitch Angle, Boundary width
Measurement data can be obtained from CAD drawings. Even if the test object is not physically available, you can still create measurement programs quickly.The system can automatically assign features and dimensions from the DXF drawing to the sample, including surface dimensions
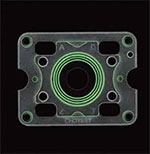 Sample
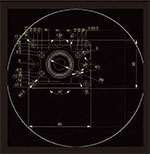 Automatically assign DXF features to the sample
 CNC Measure
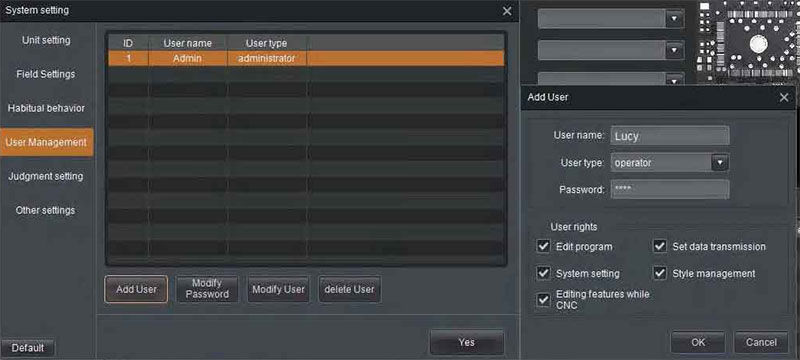
The barcode value which is read by Scanner can be saved as inspection information, or used to search program according to definition of the operator.
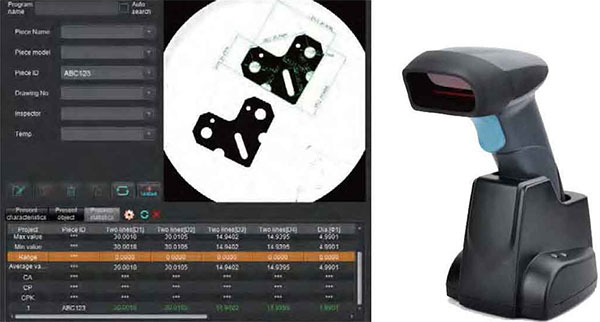
The accounts can be defined as administrator or operator, and user rights of the operator account could be constrained according to requirement.
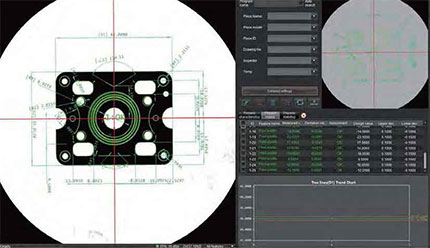
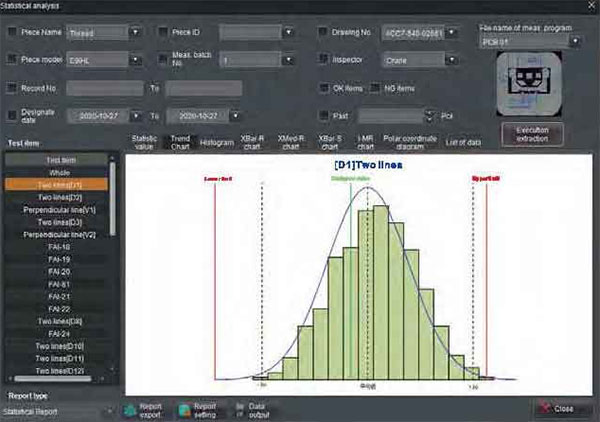
The statistical analysis interface has the tabs of [Statistical Value], [Trend Chart], [Histogram] and [Data List]
Measurement results and its main statistical information (e.g. average value, σ, 3σ, 6σ, Ca, Cp, Cpk etc) will be automatically recorded and saved. Operator could search records by different conditions.
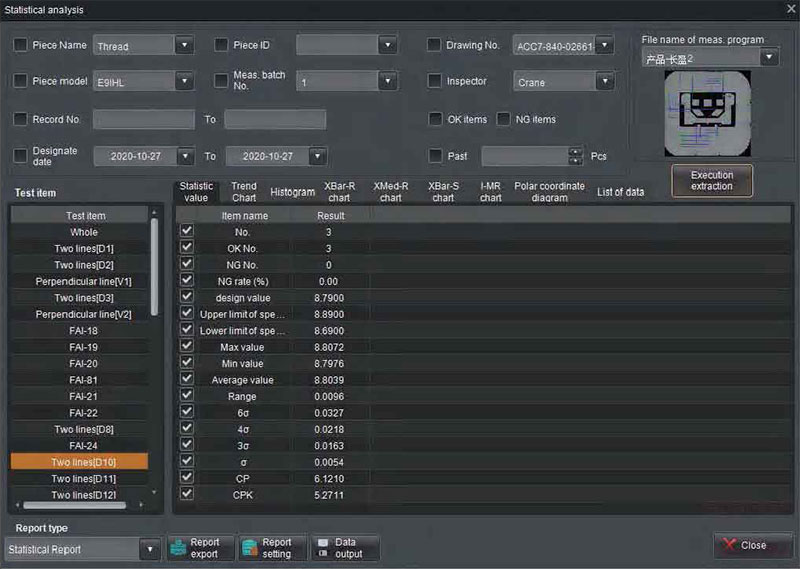
Statistic
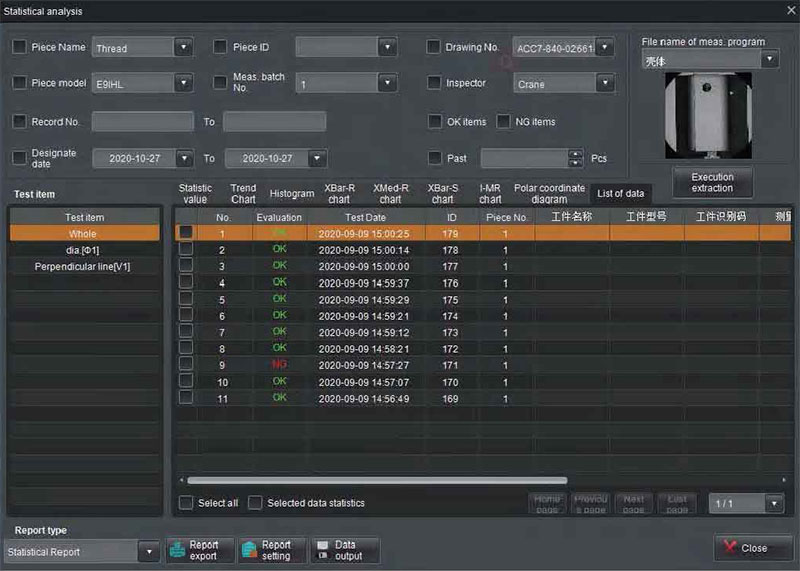
Tabled data
The trend chart monitors the abnormalities of generating equipment and production process by regularly changing trend of measured values. Such as the monotonic and periodic changes of the measured values.
The histogram reflects the fluctuation and distribution of product quality, and transmits information about process quality, which can be used to judge and predict product quality and unqualified rate.
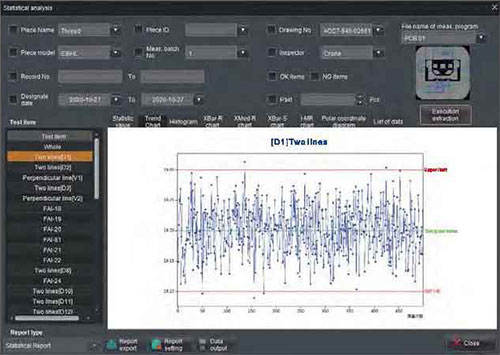
Trend Chart
Histogram
By quality diagnosis and analysis, SPC statistical method can not only realize the monitoring of product quality, but also reflect the change trend in the generation process, reduce the waste caused by post-inspection, so as to achieve the effect of controlling the production process and improving product quality.
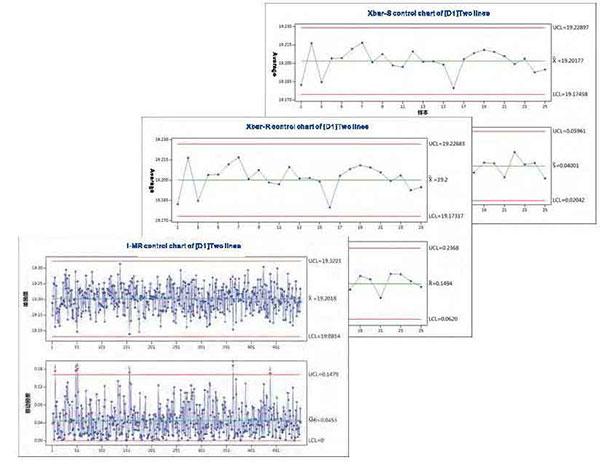
Control Charts
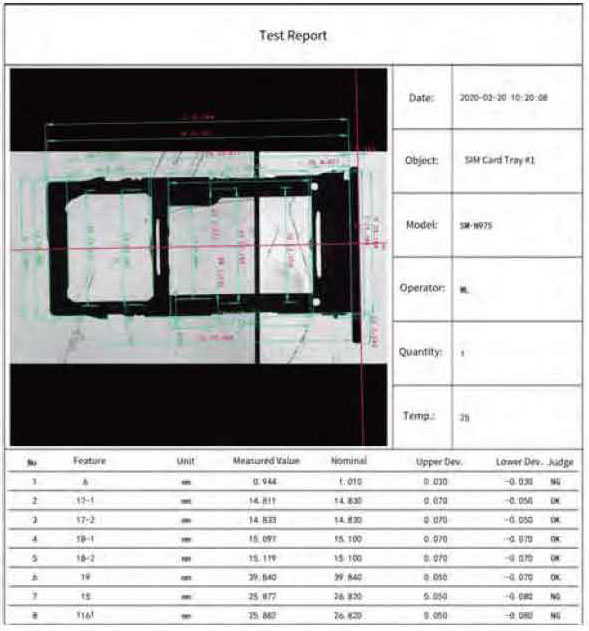
Test report
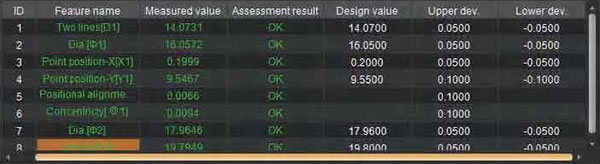
Evaluate the measured values against the given design value and upper/lower tolerances specified on the drawing.
Divide the tolerance into multiple grades according to deviation range. Evaluate the sample's grade based on the actual measured value; If the dimensions of a sample are not in the same grade, this sample is unqualified. Classifying samples into different grades facilitates assembly and reduces waste.
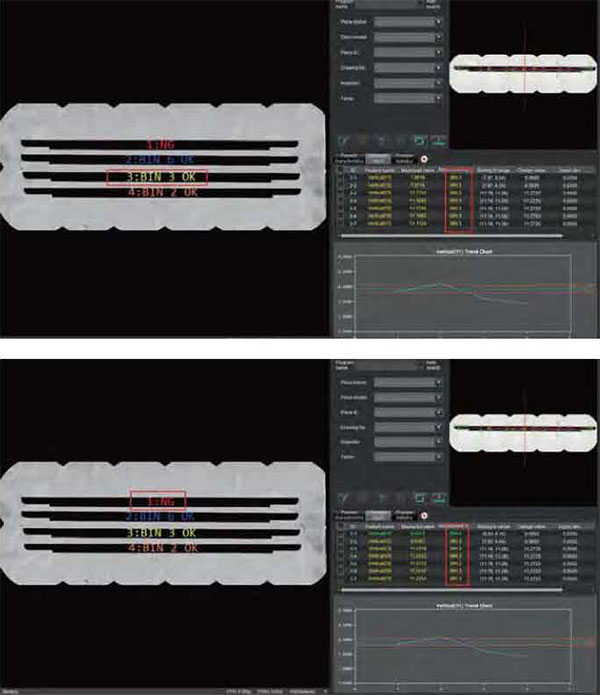
Divide the tolerance into multiple grades according to tolerance percentage. Evaluate the sample's grade based on the actual measured value, so it can be used for pre-warning of processing equipment`s state.
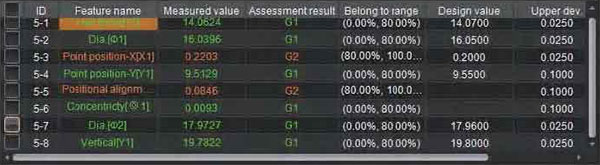
The sample is qualified by only Critical Dimensions which are specified by the operator.
Test reports can be generated simple and fast, such as PDF, WORD, EXCEL, CSV and TXT.
Automatically calculate Cp and Cpk. Real-time trend chart or histogram display quality trends and changes during measurements.
Measurement data & corresponding test images and inspection info are automatically exported into a designated Excel template in real time.
| Cutomer | LOT No. | ||
| Part name | Material | ||
| Part No. | Spec |
| Batch No. | Item | Measure value | Disign value | Upper limit | Lower limit | Inspector | Date |
| D8X62723-E75-P-N-1 | L① | 2.513 | 2.5 | 0.2 | -0.2 | Crane | 09.20 |
| D8X62723-E75-P-N-1 | L② | 2.512 | 2.5 | 0.2 | -0.2 | Crane | 09.20 |
| D8X62723-E75-P-N-1 | L③ | 2.511 | 2.5 | 0.2 | -0.2 | Crane | 09.20 |
| D8X62723-E75-P-N-1 | L④ | 2.508 | 2.5 | 0.2 | -0.2 | Crane | 09.20 |
| D8X62723-E75-P-N-1 | L⑤ | 2.509 | 2.5 | 0.2 | -0.2 | Crane | 09.20 |
| D8X62723-E75-P-N-1 | L⑥ | 2.511 | 2.5 | 0.2 | -0.2 | Crane | 09.20 |
| D8X62723-E75-P-N-1 | L⑦ | 2.513 | 2.5 | 0.2 | -0.2 | Crane | 09.20 |
| D8X62723-E75-P-N-1 | L⑧ | 2.512 | 2.5 | 0.2 | -0.2 | Crane | 09.20 |
| D8X62723-E75-P-N-1 | L⑨ | 2.509 | 2.5 | 0.2 | -0.2 | Crane | 09.20 |
| D8X62723-E75-P-N-1 | L① | 1.999 | 2 | 0.3 | -0.1 | Crane | 09.20 |
| D8X62723-E75-P-N-1 | L② | 1.997 | 2 | 0.3 | -0.1 | Crane | 09.20 |
| D8X62723-E75-P-N-1 | L③ | 1.998 | 2 | 0.3 | -0.1 | Crane | 09.20 |
| D8X62723-E75-P-N-1 | L④ | 1.997 | 2 | 0.3 | -0.1 | Crane | 09.20 |
| D8X62723-E75-P-N-1 | L⑤ | 1.997 | 2 | 0.3 | -0.1 | Crane | 09.20 |
| D8X62723-E75-P-N-1 | L⑥ | 1.999 | 2 | 0.3 | -0.1 | Crane | 09.20 |
| D8X62723-E75-P-N-1 | L⑦ | 1.996 | 2 | 0.3 | -0.1 | Crane | 09.20 |
| D8X62723-E75-P-N-1 | L⑧ | 1.999 | 2 | 0.3 | -0.1 | Crane | 09.20 |
| D8X62723-E75-P-N-1 | L⑨ | 1.997 | 2 | 0.3 | -0.1 | Crane | 09.20 |
| D8X62723-E75-P-N-1 | L① | 0.901 | 0.9 | 0.1 | -0.1 | Crane | 09.20 |
| D8X62723-E75-P-N-1 | L② | 0.904 | 0.9 | 0.1 | -0.1 | Crane | 09.20 |
| D8X62723-E75-P-N-1 | L③ | 0.904 | 0.9 | 0.1 | -0.1 | Crane | 09.20 |
| D8X62723-E75-P-N-1 | L④ | 0.903 | 0.9 | 0.1 | -0.1 | Crane | 09.20 |
| D8X62723-E75-P-N-1 | L⑤ | 0.902 | 0.9 | 0.1 | -0.1 | Crane | 09.20 |
| D8X62723-E75-P-N-1 | L⑥ | 0.905 | 0.9 | 0.1 | -0.1 | Crane | 09.20 |
| D8X62723-E75-P-N-1 | L⑦ | 0.901 | 0.9 | 0.1 | -0.1 | Crane | 09.20 |
| D8X62723-E75-P-N-1 | L⑧ | 0.903 | 0.9 | 0.1 | -0.1 | Crane | 09.20 |
| D8X62723-E75-P-N-1 | L⑨ | 0.901 | 0.9 | 0.1 | -0.1 | Crane | 09.20 |
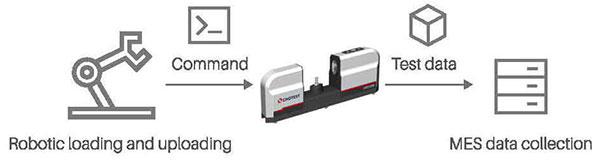
Measurement data is transmitted to the MES system of the customer via socket or HTTP protocols in real time.
VisionX also could receive commands from the external server to load the program and begin measurement, so it is compatible with robotic arms to achieve unmanned measurements.
Automatically generate test results in a format which can be recognizable by the QDAS system.

K fields can be customized to link VX machines to output parameters.

Custom Text Report: Operator can define the content format of the report in Text file, and the measurement data are exported in real time.
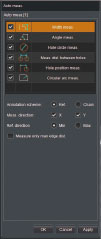
This tool can annotate distance between two points or two lines, center distance between two circles, max distance or min distance or center distance between line and circle, etc.
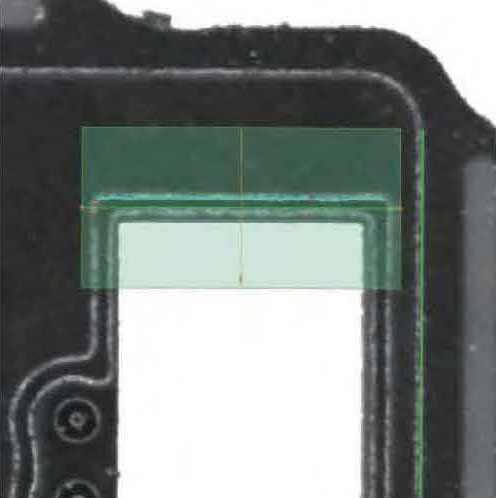
Simply highlight the region where the feature is located, and the system will automatically capture the edge.
Various edge extraction conditions can be set to exclude interference and accurately extract the target feature, even for tiny boundaries.
 Extract from dark to bright
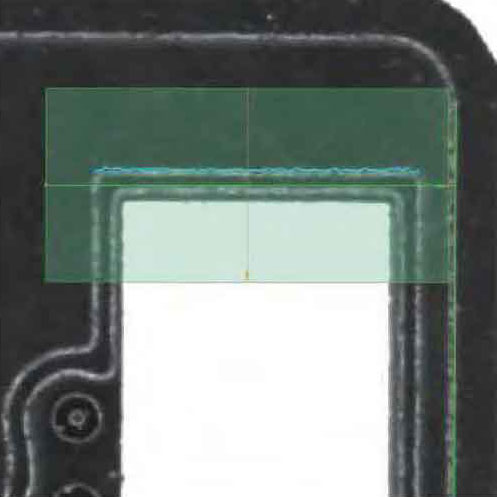 Extract from bright to dark
Automatically remove abnormal points to eliminate the interference of edge burrs, and extract features accurately.
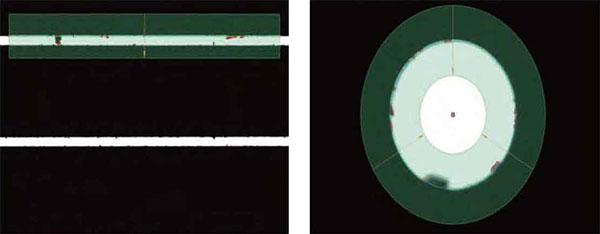
Even if boundary is discontinuous, the system can eliminate interference from nearby features. Complex settings are not required as the system automatically removes abnormal points.
The arcs at both ends of a straight line can also be automatically excluded
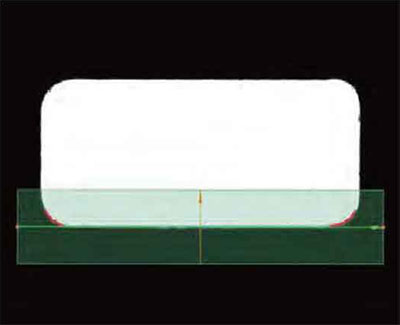
The posture adjustment function automatically adjusts the orientation of the lasso to ensure precise feature extraction.Even if the lasso does not contain the target feature appropriately, the system automatically adjusts the posture of the lasso to center on the feature.
For the measurement of peak point, the operator can set condition to constrain orientation of the lasso to ensure accurate calculation of peak value.
Flash measuring machines are widely used in industry of machinery, electronics, mold, injection molding, hardware, rubber, low-voltage electrical appliances, magnetic materials, precision stamping, connectors, connectors, terminals, mobile phones, home appliances, printed circuit boards, medical equipment, watches, tools, etc.
 spring
 Thread,Shaft