details
Description
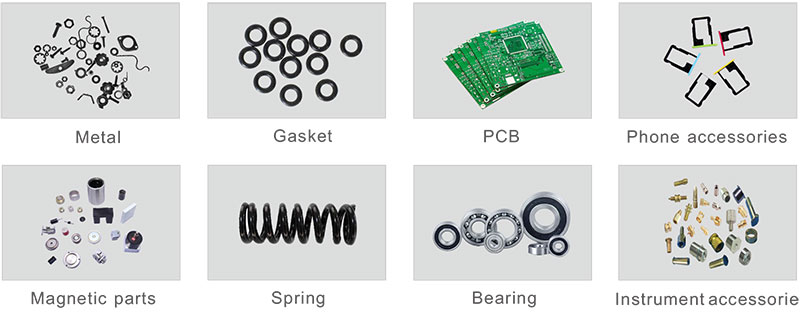
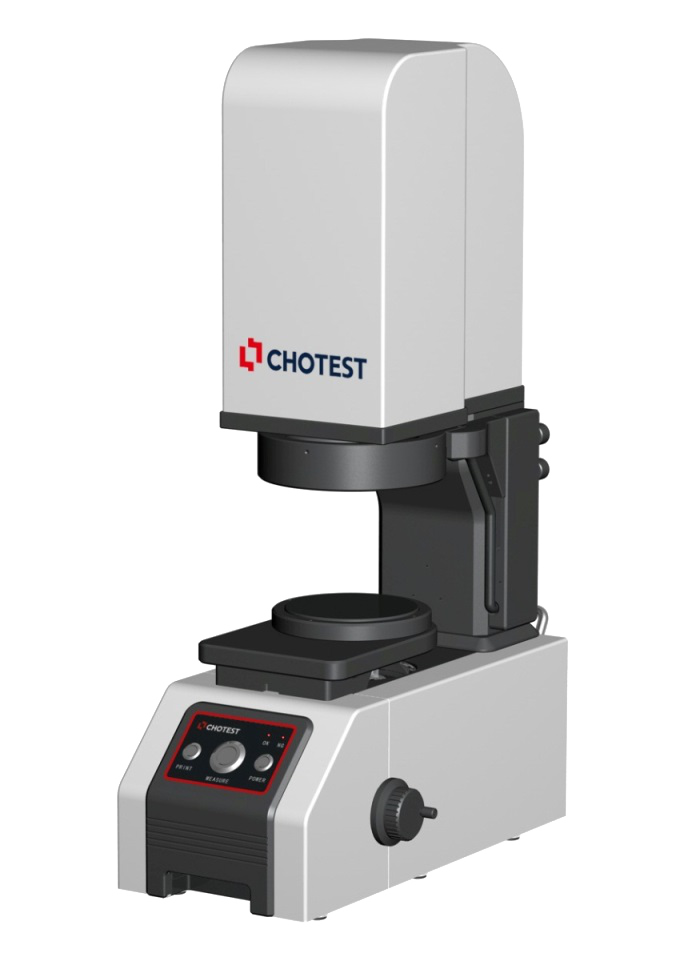
Based on visual measurement principle with precision image analysis algorithms, equipped with double telecentric optical lens with high depth of field, VX3000 series of Flash Measuring Machines achieve fast dimensional measurement by one-key operation. VX3000 series are suitable for precise dimensional measurement in the fields of machinery, electronics, molds, injection molding, hardware, rubber, low-voltage electrical appliances, magnetic materials, precision stamping, connectors, connectors, terminals, mobile phones, home appliances, printed circuit boards, medical equipment, watches, cutting tools, etc.
Parameters
|
Model No. |
VX1060 |
VX1100 |
|
Image Senor |
20M CMOS |
|
Monitor |
24" LCD (XGA:1920×1080) |
|
Acceptance Lens |
Double Telecentric Lens |
|
Light |
Ring |
Four-segment illumination(White Light) |
|
Bottom |
Telecentric transmission illumination(Green Light) |
|
F.O.V |
Φ60mm |
Φ100mm |
|
Repeatability of Image Meas. |
±1um |
±2μm |
|
Accuracy of Image Meas. |
±3um |
±4um |
|
Software |
VisionX |
|
Resolution |
0.1μm |
|
Z-Axis Travel range |
35mm |
|
Loading Capacity |
3KG |
|
Size(LxWxH) |
(500×280×670)mm |
|
Weight |
25kg |
|
Input |
AC200~240V/50~60Hz,10A,2500W |
|
Working Environment |
Temp.10℃~35℃, Humidity 20%~80%, Vibration<0.002g, Less than15Hz |
|
Remark: *1 In the focus position, the environment temperature is +20 °C ± 1.0 °C |
Applications
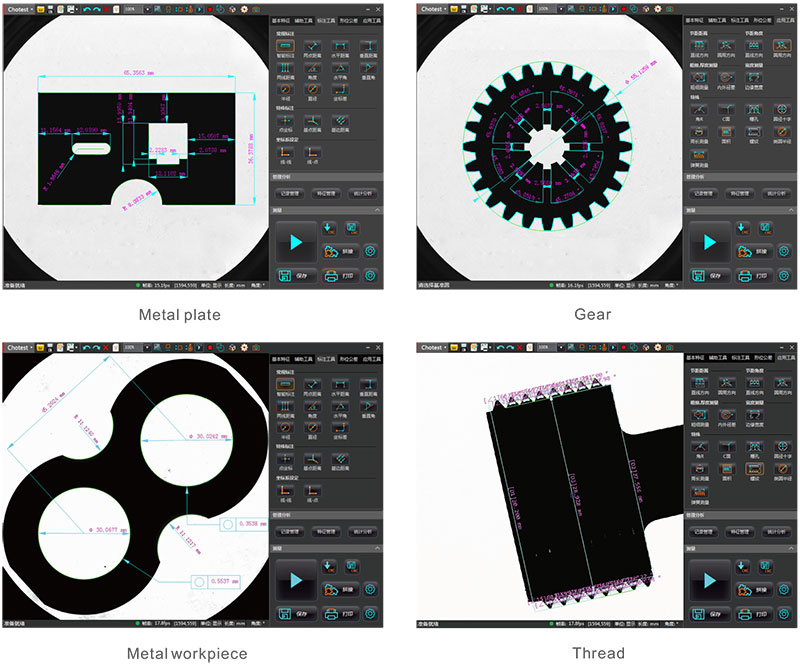
VisionX software provides up to 80 extraction analysis tools, including [Feature Extraction] (such as maximum points, centerlines, arcs, peaks, etc.), [Accessory Tools] (such as any dot & line & circle, fitted straight line, Fit circle, tangent, inscribed circle, etc.), [Smart Labeling], [shape tolerance] , special [Application Tool] (such as pitch distance, pitch angle, slot, thread, round cross, down Angle, rounded corners, etc.)
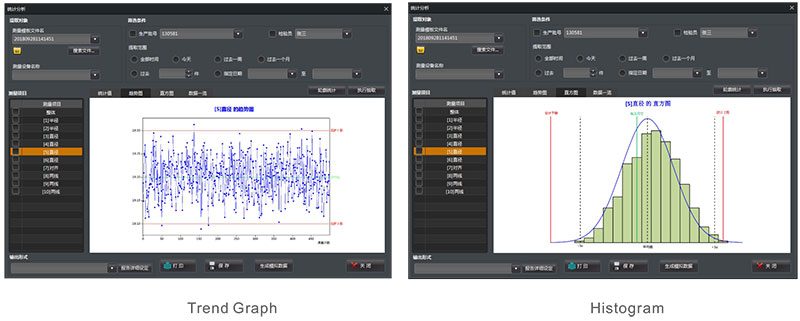
The measurement results and their main statistical values (such as average, σ, 3σ, 6σ, Ca, Cp, Cpk, etc.) will be automatically recorded and archived. Operators can select different filter conditions for history extraction.

Stratistics
The trend graph displays the regular trend of the measured values, such as the monotonic and periodic change of the measured values, which can be used for monitoring the abnormality of the production process of producing equipment. Reflecting the status and distribution of fluctuations in product quality, the histogram can intuitively expose information about the quality situation in producing process, which can be used to predict product quality and failure rate.
Through quality diagnosis and analysis with statistical methods, SPC can monitor the product quality and changing trend of the producing process. With SPC we can find the preventive solution in the producing process, so that the subsequent inspection and repair are reduced. Consequently, the producing process control and product quality improvement are achieved.

More Applications


